In the first tutorial, we learned about drawing diagrams as graphs and stylizing components of those graphs.
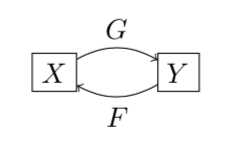
We constructed those graphs by placing nodes at fixed coordinates. However, visualizing the document grid may be tedious, especially when elements may have a perfectly simple orientation, relative to each other. For example, in this cycle consistency figure, you know that $F$ and $G$ should be midway between $X$ and $Y$, but it’s annoying to compute their exact locations.
1 | |

Luckily, there are multiple ways to position nodes beyond specifying coordinates. Let’s explore some of them.
Note: The TeX source for this post may be found here.
Example: Nodes on paths
Before we dive deep, let’s visit a motivating example of relative positioning. For diagrams, I find that it is extremely useful to place nodes on paths as labels.
1 | |

You may specify any pos between 0 and 1,
which correspond to the start and end of a path respectively.
1 | |

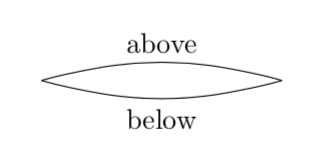
Often, we don’t want the nodes directly on top of the path. In these cases, you can easily specify that a node should be placed “above” or “below” the path. We will formalize this idea later.
With this example in mind, let’s start from the fundamentals.
Anchors
In the figure above, you may notice that the center node
is vertically centered, while the above and below nodes
are positioned conveniently not to obscure the label.
This behavior is due to anchors,
which specify which part of a node its position is rooted to.
At first, it may be slightly counterintuitive that an east anchor places the node to the west, and vice versa.
1 | |

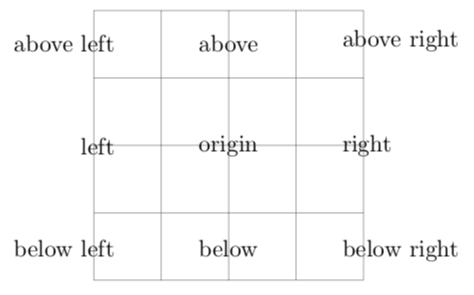
By default, each node is anchored at center.
There are also 8 other built-in anchors, depicted above.
It is helpful to change anchors when nodes are explicitly placed
relative to other elements.
However, you usually don’t have to adjust the anchor yourself;
TikZ has very nice defaults for this behavior, as we will see next.
Relative positioning
The positioning library allows you to place nodes
at a specified direction and distance from other nodes.
To load the library, include in your preamble:
You place nodes in any of 8 directions.
1 | |

These relative positions also change the default anchor of the node.
Node labels
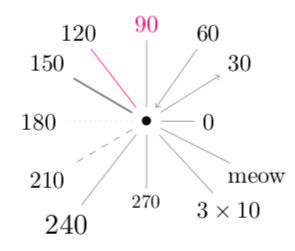
You may have noticed that labels for each node are generally placed in the absolute center. While this behavior is reasonable for most cases, sometimes you will need to shift the position of a label. For example, in the anchors figure above, it was more clear to place the label below the node, rather than in the middle. Luckily, it’s simple to do so.
1 | |

The general syntax is:
where angle may specify a numeric angle or a relative position,
and text is displayed as your label text.
Behind the scenes, each label is a new node,
created and placed at the location you specify.
1 | |

If for any reason, you want an extra line connecting
your label and the original node, you may replace
label with pin with no other changes.